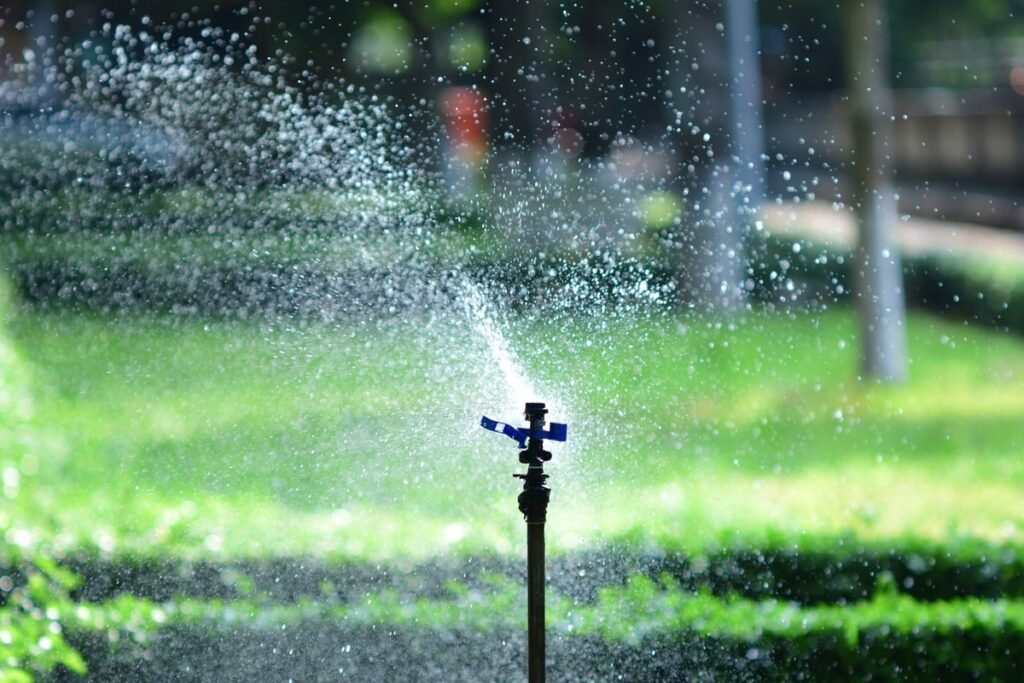
A catch cup test measures how much water your sprinklers really put down, in millimetres per hour, so you can see whether water is soaking in or running off. Place straight sided cups across the zone, run it for 15 minutes, measure the average depth, and multiply by 4. That hourly rate is the real rate for that zone.
A formula can only describe a layout on paper. The sprinkler coverage calculator gives a precipitation rate from flow, head spacing, and row spacing, with precipitation rate equal to full circle flow times 60 divided by head spacing times row spacing. Wind, low pressure, and mixed nozzles can change what actually lands.
Runoff is the sign that water is arriving faster than the ground can take it in. Puddles form, water moves across the surface, and water leaves the area it was meant to water. A catch cup test gives you a number you can act on.
What You Need Before You Start
You need straight sided cups of the same size, a ruler marked in millimetres, a timer, and a way to note each reading. Straight sided cups matter because a cup that narrows toward the base will make the same volume of water look deeper than it is, and a cup that widens will make it look shallower.
Small straight sided food cans and straight sided plastic cups all work if the sides are vertical and the base is flat. Run the test when the zone would normally run, and do not change the pressure, the nozzles, or the run time for the test.
How To Run The Catch Cup Test Step By Step
Start with the zone off and the cups empty and dry. Place cups across the lawn in the area that the zone waters, with cups near heads, between heads, near edges, and in the middle of the zone. The page method is simple: straight sided cups across the lawn, run the zone for 15 minutes, measure the average depth, and multiply by 4 for the hourly rate.
Use six to ten cups across a small zone, and more cups on a larger zone. Put each cup flat on the ground, with the rim level. Run the zone for 15 minutes exactly, starting the timer when the heads are up and watering. Stop at 15 minutes, and read the cups promptly, at eye level, with the ruler vertical inside the cup, to the nearest whole millimetre.
Add the depths together and divide by the number of cups to get the average depth. Multiply that average by 4 to get the hourly rate. Keep the individual readings as well as the average.
What The Average Depth Means
The table below turns an average depth after 15 minutes into an hourly precipitation rate. Each rate is the average depth multiplied by 4. The depths are example inputs worked through that same multiplication.
| Average depth after 15 minutes | Hourly precipitation rate |
|---|---|
| 2 mm | 8 mm per hour |
| 3 mm | 12 mm per hour |
| 4 mm | 16 mm per hour |
| 5 mm | 20 mm per hour |
| 6 mm | 24 mm per hour |
| 7 mm | 28 mm per hour |
Read your result from the average, not from the wettest cup and not from the driest cup. If your average is 3 mm, your rate is 12 mm per hour. If your average is 6 mm, your rate is 24 mm per hour. If your average falls between two rows, multiply your own average by 4.
How To Read Your Result Against The Lawn Range
The verified page says most lawns take 12 to 25 mm per hour without runoff, and clay soils prefer the lower end of that range. A rate inside the range is a rate that most lawns can take in without runoff, in normal conditions. A rate below the range is not a runoff risk, but it may mean a longer run is needed. A rate above the range is a runoff risk, and it needs a change in how you water.
Clay prefers the lower end because clay takes water in slowly, and water that arrives faster than clay can take it will sit on the surface and move. The calculator gives no infiltration figure for any soil type. It only says to compare the precipitation rate with your soil infiltration rate, and it gives the 12 to 25 mm per hour range, with clay preferring the lower end. Do not take a number from this blog as an infiltration rate for your soil, because no such number is given here.
What To Do When The Measured Rate Is Above The Range
A rate above 25 mm per hour means water is arriving faster than most lawns can take in without runoff. The first change is to shorten the run, so less water arrives in one continuous run, and the ground has a chance to take it in. A shorter run puts down less depth, so you may need more runs.
Cycle and soak is the second change. Split a long run into two or more short runs, with a soak gap between them, so the first short run can soak in before the second short run starts. The total depth can stay the same. Wider spacing is the third change. Wider spacing puts the same flow over a larger area, so the rate per hour falls, if the heads still cover the area evenly. Check the coverage after a spacing change with another catch cup test.
What To Do When Cups Differ A Lot
A large spread between cups means uneven coverage, and uneven coverage means some parts of the lawn get too much water while other parts get too little. A longer run will make the wet parts wetter without fixing the dry parts. The average rate can look fine while the spread is poor, so look at the individual readings as well as the average.
Mixed nozzles are one cause of a large spread. The calculator assumes matched precipitation nozzles, and mixed nozzles apply unevenly. Check that the nozzles in the zone match, and replace a mismatched nozzle with a matching one. Wind is another cause, with cups on the downwind side wetter than cups on the upwind side. Low pressure is another cause, and it can shorten throw, so cups near the heads may be wetter than cups between heads. A blocked nozzle, a tilted head, and a head that does not rise fully can also make one cup very different from the rest.
Why The Measured Rate Can Differ From The Formula Rate
The formula rate comes from flow, head spacing, and row spacing, and it assumes the layout works as drawn. The measured rate comes from cups on the lawn, and it records what actually happened. A difference between the two is not a mistake in the test, and it is not a mistake in the formula.
Wind and low pressure reduce real throw, so water that should have reached a cup between heads may fall short. Mixed nozzles apply unevenly, so the formula rate, which assumes matched precipitation nozzles, will not describe a zone where nozzles do not match. Use the measured rate for run time, not the formula rate, when the two differ. The irrigation run time calculator is the place to turn a rate into minutes once you have a measured rate you trust.
Using The Measured Rate To Set Run Time
Run time equals depth divided by precipitation rate. The verified worked example anchors the link: a rate of 24 mm per hour puts down 12 mm in 30 minutes, because 12 divided by 24 is one half of an hour. Use your measured rate in the same division, with the depth you want, to get the run time for your zone.
| Measured rate | Run time for 12 mm |
|---|---|
| 8 mm per hour | 90 minutes |
| 12 mm per hour | 60 minutes |
| 16 mm per hour | 45 minutes |
| 20 mm per hour | 36 minutes |
| 24 mm per hour | 30 minutes |
| 28 mm per hour | 26 minutes |
The last row is approximate, because 12 divided by 28 is 25.7 minutes, rounded to 26 minutes for the controller. If your measured rate is not in the table, divide 12 by your rate, multiply by 60, and use that result, and if your target depth is not 12 mm, divide your target depth by your rate and multiply by 60 in the same way. The garden watering schedule calculator can help with how often to water once the run time is set, and the sprinkler calculator can help with a general check of flow and coverage when you are planning a change.
Common Mistakes
One common mistake is to use cups of different sizes, or cups with sloping sides, and then to compare depths as if the cups were the same. A second mistake is to place cups in one place only, or in a single line, and then to treat that one place as the whole zone. A third mistake is to run the test for a different time, and then to multiply by 4 as if the run had been 15 minutes. The multiplication by 4 only works for a 15 minute run, because 15 minutes is one quarter of an hour.
A fourth mistake is to read the cups long after the zone stops, when evaporation has changed the depths, or to read the cups at an angle. A fifth mistake is to use the wettest cup, or the driest cup, as the rate, instead of the average, and to ignore the spread and act on the average alone.
FAQs
Q: How long should I run a catch cup test?
A: Run the zone for 15 minutes, then measure the average depth and multiply by 4 to get the hourly rate. A 15 minute run is one quarter of an hour, so the multiplication by 4 turns the depth into millimetres per hour.
Q: What is a good precipitation rate for a lawn?
A: Most lawns take 12 to 25 mm per hour without runoff, and clay soils prefer the lower end. A rate above that range is a runoff risk and needs shorter runs or split runs.
Q: Why do my cups show very different depths?
A: A large spread means uneven coverage, and the usual causes are mixed nozzles, wind, low pressure, a blocked nozzle, or a tilted head. Check the nozzles, the wind, and the heads on the ground, then test again after a fix.
Q: Why is my measured rate different from the formula rate?
A: The formula rate assumes matched precipitation nozzles and full throw, while wind and low pressure reduce real throw and mixed nozzles apply unevenly. Use the measured rate for run time when the two differ.
Q: How do I set run time from my measured rate?
A: Divide the depth you want by your measured rate, then multiply by 60 to get minutes. A rate of 24 mm per hour puts down 12 mm in 30 minutes, and a rate of 12 mm per hour puts down 12 mm in 60 minutes.
More guides
Hargreaves vs Penman Monteith: When the Simple Estimate Is Enough
Hargreaves vs penman monteith is a choice between a simple estimate from temperature alone and a fuller calculation from complete weather data.…
Read guide
Daily ET0 vs Monthly Average ET0: Planning vs Scheduling
Daily ET0 vs monthly ET0 is a choice between one day and a month. Use a monthly average to plan a season,…
Read guide
How Latitude and Date Change Your ET0
Latitude and ET0 are linked through Ra, the extraterrestrial radiation that reaches the top of the atmosphere. When latitude or date changes,…
Read guide