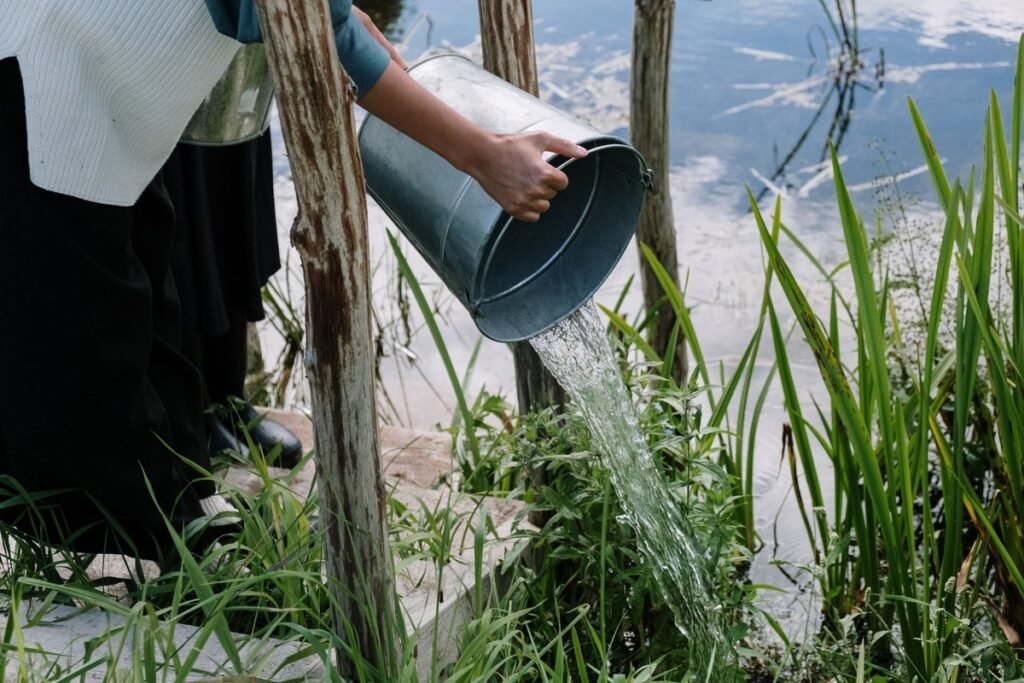
A drip flow rate bucket test measures drip flow by catching water in a bucket for a set time and scaling that catch to one hour. Catch 1 litre in 30 seconds and the flow is 120 litres per hour. The drip version, distinct from the sprinkler test, covers supply at the spigot and output from drip lines.
What the Drip Flow Rate Bucket Test Measures
A drip flow rate bucket test gives one number, flow per hour, from a catch you can see and measure. You catch water for a known number of seconds, note how much you caught, and scale that catch to a full hour. The result tells you how fast water is moving at that point, in litres per hour or in gallons per hour.
Drip flow is hard to judge by eye. A line that looks busy can still deliver far less than the emitters are rated to give. A timed catch replaces guesswork with a measured result. This is the drip version of the test, distinct from the sprinkler bucket test in Batch 27, which asks how much water a sprinkler zone draws.
The Timed Catch Formula
The calculator formula is short, and every worked example in this guide uses it. Flow equals water caught divided by seconds, multiplied by 3600. The number 3600 is the number of seconds in one hour, so the formula scales a short catch to a full hour. In metric units, enter the catch in litres and the answer is litres per hour. In imperial units, enter the catch in gallons and the answer is gallons per hour.
The page example is the anchor for the whole guide. Catch 1 litre in 30 seconds, divide 1 by 30 to get 0.0333, then multiply by 3600 to get 120 litres per hour. Check it by working backwards. At 120 litres per hour, the flow in 30 seconds is 1 litre, because 30 seconds is one 120th of an hour.
| Part of the formula | What to enter | Result |
|---|---|---|
| Water caught | Litres or gallons caught in the bucket | The amount for the timed period |
| Time | Seconds the catch ran | The length of the timed period |
| Multiplier | 3600 seconds in one hour | Scales the catch to one hour |
| Flow | Water caught divided by seconds multiplied by 3600 | Litres per hour or gallons per hour |
Use One: Testing Supply at the Spigot
The first use tests what the tap can deliver before the drip system takes any water. Put a bucket under the spigot, turn the tap fully on, start the timer at the same moment, and stop the timer when you stop the flow. Measure the water with a measuring jug, note the seconds, and use the formula to find the supply flow.
A short catch is enough for a supply test, because supply flow is usually high. Thirty seconds is a good length, and 60 seconds is better if the bucket is large enough. A very short catch, under 10 seconds, gives a large error from a one second mistake in timing, so avoid it. Record the result as supply flow. No drip zone can draw more water per hour than the supply delivers.
| Water caught | Time | Supply flow |
|---|---|---|
| 5 litres | 30 seconds | 600 litres per hour |
| 5 litres | 60 seconds | 300 litres per hour |
| 10 litres | 30 seconds | 1200 litres per hour |
| 10 litres | 60 seconds | 600 litres per hour |
| 4 litres | 40 seconds | 360 litres per hour |
Use Two: Catching System Output
The second use tests what the drip system itself delivers, and it is a different job from the supply test. Run the drip system as normal, catch the output from one line for a timed period, and use the same formula. The result is the flow of that part of the system while it runs.
To catch system output, hold a bucket or a large jug under the open end of a drip line, or under a group of emitters that drain into one container. Start the timer when water first enters the container, and stop it when you lift the container away. Keep the rest of the system running as normal, because shutting other lines changes the pressure and the result.
Keep the two uses apart in your notes, with the supply result labelled supply and the system result labelled system output. Only a pair of tests, one at the spigot and one at the line, shows where water is lost between tap and plants.
Worked Tables in Litres per Hour
The metric table below uses the calculator formula only. Each row is a separate catch, and each flow is recomputed from water caught divided by seconds multiplied by 3600. The page example, 1 litre in 30 seconds giving 120 litres per hour, appears in the table. Doubling the catch doubles the flow, and doubling the time halves the flow.
| Water caught | Time | Flow |
|---|---|---|
| 0.5 litre | 15 seconds | 120 litres per hour |
| 0.5 litre | 30 seconds | 60 litres per hour |
| 1 litre | 15 seconds | 240 litres per hour |
| 1 litre | 30 seconds | 120 litres per hour |
| 1 litre | 60 seconds | 60 litres per hour |
| 2 litres | 30 seconds | 240 litres per hour |
| 2 litres | 60 seconds | 120 litres per hour |
| 0.25 litre | 15 seconds | 60 litres per hour |
| 3 litres | 60 seconds | 180 litres per hour |
| 1.5 litres | 45 seconds | 120 litres per hour |
Worked Tables in Gallons per Hour
The imperial table below is kept separate from the metric table on purpose. Treat metric and imperial figures as rounded equivalents, not exact conversions, and keep each calculation in one set of units. Work in gallons for the whole test, from the catch to the result, and use the same formula.
| Water caught | Time | Flow |
|---|---|---|
| 0.25 gallon | 15 seconds | 60 gallons per hour |
| 0.25 gallon | 30 seconds | 30 gallons per hour |
| 0.5 gallon | 15 seconds | 120 gallons per hour |
| 0.5 gallon | 30 seconds | 60 gallons per hour |
| 1 gallon | 30 seconds | 120 gallons per hour |
| 1 gallon | 60 seconds | 60 gallons per hour |
| 2 gallons | 60 seconds | 120 gallons per hour |
| 1 gallon | 15 seconds | 240 gallons per hour |
| 0.5 gallon | 60 seconds | 30 gallons per hour |
| 2 gallons | 30 seconds | 240 gallons per hour |
How to Repeat the Test and Average the Results
One catch gives one result, and one result can be thrown off by a late start, an early stop, or a spill. Repeat the test and average the results, and the average will be steadier than any single catch. Three catches are enough for most garden tests. Repeat the test in the same way each time, with the same bucket, the same tap setting, and the same timed length.
To average, add the three flow results together and divide by three. For example, three system catches of 110, 120, and 130 litres per hour add to 360, and 360 divided by three gives an average of 120 litres per hour. If one result sits far from the other two, repeat that catch once more.
What a Low Result Can Mean
A low result needs care, not a quick diagnosis. A low supply result can mean a tap limit, and a low system result can mean a clogged filter, pressure loss along the line, or a tap limit. The calculator page names a clogged filter as a cause of reduced flow, and it notes that real capacity depends on run length, slope, and pressure.
Start with the simplest check. Compare the supply result with the system result. If supply is high and system output is low, the loss sits between the tap and the catch point, so check the filter first. If supply is low and system output is low by the same amount, the limit sits at the tap. Change one thing, then repeat the test and compare the new average with the old one.
Reading the Result Against Tubing Capacity
A bucket test result is most useful when it is read against the tubing it must pass through. Tubing of 1/4 inch carries about 115 litres per hour, about 30 gallons per hour, and tubing of 1/2 inch carries 900 litres per hour, 240 gallons per hour, in the capacity line.
The page also gives guidance to keep use under about 80 percent of capacity. Worked from the page figures, that working limit is about 92 litres per hour, 24 gallons per hour, for 1/4 inch tubing, and about 720 litres per hour, 192 gallons per hour, for 1/2 inch tubing. Those limits are arithmetic from the page figures, not page figures themselves. Use the Drip Flow Rate Calculator to enter your own catch and see the capacity used result for your tubing.
Common Mistakes
The most common mistake is mixing the two uses and comparing a supply result with a system limit. Test supply at the spigot and test output at the line, and label each result. A second mistake is timing the catch by eye instead of with a timer. A few seconds of error in a 15 second catch changes the flow by a large amount, so use a phone timer.
A third mistake is reading the volume in the wrong units. Litres in a jug marked in gallons, or gallons in a jug marked in litres, will give a flow that looks precise and is wrong. A fourth mistake is trusting one catch. Repeat the test three times, average the results, change one thing, and retest.
What the Calculator Does Not Give
The calculator gives total flow and capacity used, and it stops there. It gives no cost figures, no pump sizing, pressure, or head figures, and no run time figures. Run time belongs to the drip emitter calculator, and this guide does not make run time its main subject. It gives no per plant water need, and no zone count formula beyond the advice to split into zones if flow is over capacity.
It gives no emitter spacing, tubing length, or fitting counts, and no capacity figure for 20 mm tubing, so this guide states no figure for that size. It gives no maximum run length figures, and for inline drip line maximum run length it refers the reader to the maker chart, as the page does. If you need a watering plan, use the Garden Watering Schedule Calculator and the Irrigation Scheduling Calculator, which cover scheduling, a different question from flow.
Q: What is a drip flow rate bucket test?
A: It is a timed catch test. Catch water in a bucket for a set number of seconds, then use water caught divided by seconds multiplied by 3600 to find flow in litres per hour or gallons per hour.
Q: How long should I time a bucket test?
A: Time 30 to 60 seconds for most tests. Use 60 seconds for a slow drip line, and avoid catches under 10 seconds, because a one second timing error changes the result by a large amount.
Q: What does 1 litre in 30 seconds mean?
A: It means 120 litres per hour. Divide 1 by 30 to get 0.0333, then multiply by 3600 to get 120 litres per hour, which is the worked example on the calculator page.
Q: Should I test at the spigot or at the drip line?
A: Test both, and keep the results apart. The spigot test shows what the supply can deliver, and the drip line test shows what the system delivers. A pair of tests shows where water is lost between tap and plants.
Q: How many times should I repeat a bucket test?
A: Repeat it three times in the same way, then average the three flow results. Repeat a catch that sits far from the other two before you trust the average.
Q: What should I do if my bucket test result is low?
A: Repeat the test first to rule out a timing error or a spill. Then compare supply with system output. A clogged filter, pressure loss, or a tap limit can each reduce flow, so check one thing at a time and retest after each change.
More guides
Hargreaves vs Penman Monteith: When the Simple Estimate Is Enough
Hargreaves vs penman monteith is a choice between a simple estimate from temperature alone and a fuller calculation from complete weather data.…
Read guide
Daily ET0 vs Monthly Average ET0: Planning vs Scheduling
Daily ET0 vs monthly ET0 is a choice between one day and a month. Use a monthly average to plan a season,…
Read guide
How Latitude and Date Change Your ET0
Latitude and ET0 are linked through Ra, the extraterrestrial radiation that reaches the top of the atmosphere. When latitude or date changes,…
Read guide