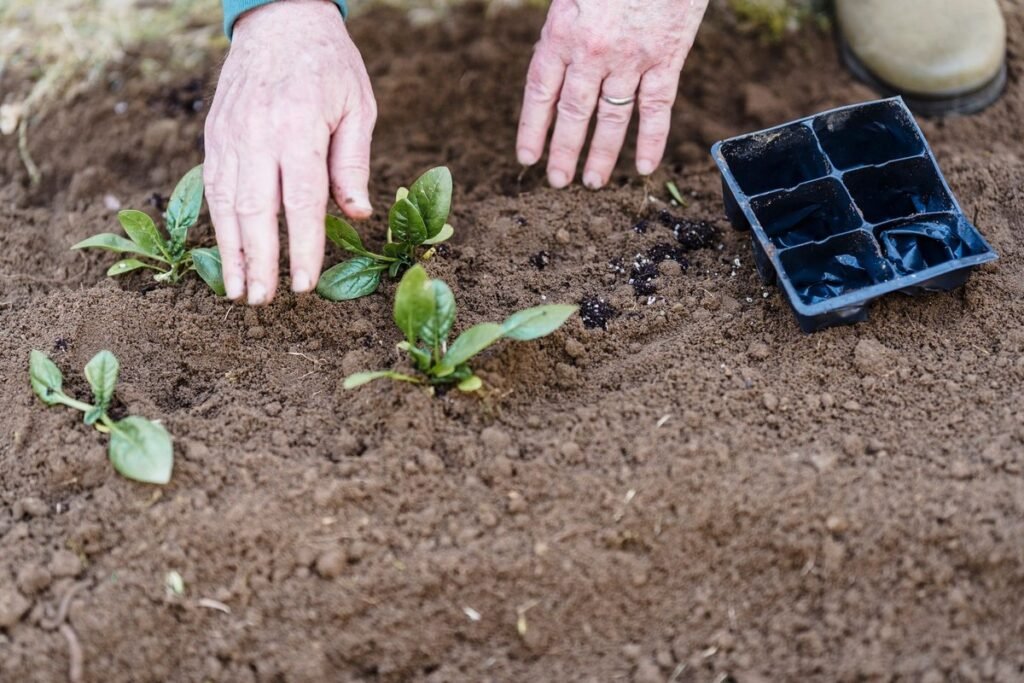
Crop coefficient by growth stage is the Kc value that turns reference evapotranspiration into crop water use at each stage. Kc starts low, rises as the canopy grows, peaks at full canopy, and falls as leaves age. Tomato at full canopy has Kc 1.15, so with ET0 of 5 mm a day, crop water use is 5.8 mm a day.
What a Crop Coefficient Is
A crop coefficient, written Kc, is a factor that adjusts reference evapotranspiration for a particular crop and growth stage. That definition comes from the Crop Water Requirement Calculator page. Reference evapotranspiration, written ET0, is the water used by a well watered grass surface under local weather. ET0 carries the weather. Kc carries the crop.
The formula is ETc equals Kc times ET0. If ET0 is 5 mm a day and Kc is 1.15, ETc is 5.75 mm a day, which rounds to 5.8 mm a day. If Kc falls to 0.70 while ET0 stays at 5 mm a day, ETc falls to 3.5 mm a day.
Kc is not a fixed property of a crop name. A tomato seedling and a tomato plant at full canopy share a name, but they do not share a water need. The seedling has little leaf area. The plant at full canopy has a large leaf area, intercepts much more sun, and transpires much more water.
FAO 56 adds that Kc integrates transpiration from leaves and evaporation from soil. In the initial stage, much water loss can be evaporation from bare soil. As cover grows, transpiration takes a larger share. FAO 56 also notes that frequent wetting can lift the early value, and can approach 1.0 to 1.2. Kc values assume a healthy, well watered crop.
How Crop Coefficient by Growth Stage Changes Tomato Water Use
Crop coefficient by growth stage changes because the plant itself changes. The initial stage covers planting to early establishment. The development stage covers rapid canopy growth. The mid season stage covers effective full cover to the start of ageing. The late season stage covers ageing to harvest or to the end of the crop.
FAO 56 says only three Kc values are required to describe the Kc curve. Those are Kc at the initial stage, Kc at the mid season stage, and Kc at the end of the late season stage. The curve stays flat, rises in a straight line through development, stays flat, and then falls in a straight line through late season.
Stage length matters as much as Kc value. A stage that lasts 40 days at a high Kc uses far more water in total than a stage that lasts 10 days at the same Kc. For tomato planted in April or May in a Mediterranean region, the lengths are 30 days initial, 40 days development, 45 days mid season, and 30 days late season, with a total of 145 days.
The Four Growth Stages in Plain Terms
Initial Stage
The initial stage runs from planting to the point where the crop begins to cover the ground. Leaves are small and sparse. Much soil is bare. Water loss is dominated by evaporation from soil. Kc is at its lowest point for most vegetables. For the Solanum family, FAO 56 Table 12 gives a group Kc value at the initial stage of 0.6.
Development Stage
The development stage runs from the end of the initial stage to effective full cover. Leaves expand, stems lengthen, and ground cover rises day by day. Kc rises with cover, in a straight line from the initial Kc to the mid season Kc. No single Kc value describes the whole stage.
Mid Season Stage
The mid season stage runs from effective full cover to the start of senescence, which is the ageing of leaves. During mid season, Kc stays at its peak. Tomato at full canopy has Kc 1.15. FAO 56 Table 12 gives the same tomato Kc at mid season as 1.15. The small vegetables group is listed at 1.05 for mid season.
Late Season Stage
The late season stage runs from the start of senescence to harvest. Leaves age, some leaves fall, fruit ripens, and the canopy thins. Kc falls from the mid season peak to the end value. FAO 56 gives tomato Kc at the end of the late season as 0.70 to 0.90. The Solanum group end value is 0.80, inside that range.
Tomato Kc Values by Stage
The table below brings the verified numbers together. Only values read on the calculator page or in FAO 56 Chapter 6 appear here. Where no verified number exists, the table says so in plain words.
| Stage | What happens | Kc value | Source |
|---|---|---|---|
| Initial | Small plants, bare soil, evaporation dominates | 0.6 | FAO 56 Solanum group |
| Development | Canopy grows fast, cover rises daily | No single value, rises from 0.6 toward 1.15 | FAO 56 Kc curve |
| Mid season | Full canopy, peak transpiration | 1.15 | Calculator page and FAO 56 tomato |
| Late season end | Leaves age, canopy thins, fruit ripens | 0.70 to 0.90 | FAO 56 tomato |
| Stage | Length in days | Kc value | Daily ETc at ET0 5 mm |
|---|---|---|---|
| Initial | 30 | 0.6 | 3.0 mm |
| Development | 40 | Rises from 0.6 toward 1.15 | Rises from 3.0 mm toward 5.8 mm |
| Mid season | 45 | 1.15 | 5.8 mm |
| Late season | 30 | Falls from 1.15 toward 0.70 to 0.90 | Falls from 5.8 mm toward 3.5 mm to 4.5 mm |
| Total | 145 | Not a single value | Not a single value |
Check the arithmetic. Initial daily ETc is 0.6 times 5, which is 3.0 mm. Mid season daily ETc is 1.15 times 5, which is 5.75 mm, rounded to 5.8 mm. Late season low end is 0.70 times 5, which is 3.5 mm. Late season high end is 0.90 times 5, which is 4.5 mm.
Worked Example in Metric Units
Use the calculator formulas with ET0 of 5 mm a day and a tomato bed of 10 square metres. The formulas are ETc equals Kc times ET0, weekly use equals ETc times 7, net irrigation equals weekly use minus effective rain, and volume equals depth times area.
At the initial stage, Kc is 0.6. Daily ETc is 3.0 mm a day. Daily volume is 30 litres a day. Weekly volume is 210 litres a week. If effective rain is 10 mm, rain volume is 100 litres. Net irrigation is 110 litres for the week.
At mid season, Kc is 1.15. Daily ETc is 5.75 mm a day, rounded to 5.8 mm a day. Daily volume is 57.5 litres a day. Weekly volume is 402.5 litres a week, rounded to 403 litres a week. With 10 mm of effective rain, net irrigation is 303 litres for the week. Those are the exact figures in the calculator worked example.
At the end of the late season, Kc is 0.70 to 0.90. At the low end, daily ETc is 3.5 mm a day, daily volume is 35 litres a day, weekly volume is 245 litres a week, and net irrigation is 145 litres for the week. At the high end, daily ETc is 4.5 mm a day, daily volume is 45 litres a day, weekly volume is 315 litres a week, and net irrigation is 215 litres for the week.
Weekly net irrigation is 110 litres at the initial stage, 303 litres at mid season, and 145 litres to 215 litres at the end of the late season. Mid season needs almost three times the net water of the initial stage. The calculator FAQ states that a vegetable garden typically uses 4 to 7 mm a day in summer.
Worked Example in Imperial Units
This section is separate from the metric example above, and its figures are rounded equivalents, not exact conversions. The method is the same. ETc equals Kc times ET0, weekly use equals ETc times 7, and net irrigation equals weekly use minus effective rain.
Take a tomato bed of 100 square feet at mid season, with Kc 1.15 and ET0 of 5 mm a day. Daily ETc is 5.8 mm a day, a rounded equivalent of about 0.14 gallons per square foot per day. Daily volume is 14.1 gallons a day. Weekly volume is 98.8 gallons a week. At the initial stage, daily volume is 7.4 gallons a day and weekly volume is 51.5 gallons a week. At the end of the late season, daily volume is 8.6 to 11.0 gallons a day and weekly volume is 60.1 to 77.3 gallons a week.
Do not mix the two unit systems in one calculation. Pick metric or imperial for a bed, keep area in the matching unit, and keep rain in the matching depth unit. The calculator page gives no separate imperial formula and no conversion formula, so this guide does not invent one.
How to Use Kc Each Week
Start with the stage, not with the number. Look at the plants and name the stage in plain terms. Are leaves small with bare soil showing. Is cover rising fast. Is the canopy full. Are lower leaves yellowing. That observation fixes the stage, and the stage fixes the Kc range to use.
Next, get ET0 for the week. The calculator asks for ET0 for today or for the average ET0, and it does not calculate ET0 from temperature or date. Use a local ET0 value. A weekly average gives a steadier irrigation amount.
Then apply the formula. Multiply Kc by ET0 to get daily ETc. Multiply by 7 to get weekly use. Subtract effective rain to get net irrigation. Multiply depth by area to get volume. The Crop Water Requirement Calculator does those steps in one place. The Garden Watering Schedule Calculator helps set how often to water, and the Irrigation Scheduling Calculator helps place the weekly amount into a schedule.
If water is applied through drip lines, check the delivery side as well. The Drip Emitter Calculator helps work out what emitters deliver. The calculator page does not give pump size, pressure, pipe sizing, or run time in minutes. Revisit the stage every week.
Common Mistakes
Using one Kc for the whole season is the most common mistake. It over waters young plants and under waters plants at full canopy. Change Kc when the stage changes, and step it up through development.
Using the mid season Kc at planting is a close second. Tomato Kc 1.15 is a mid season value, not a season value. At planting, the Solanum group value is 0.6, and the daily water need is about half the mid season need.
Ignoring soil evaporation in the initial stage is another error. Early Kc is low because leaves are small, but evaporation from wet bare soil can still be large. FAO 56 warns that frequent wetting can lift the early value substantially.
Forgetting rain is a simple arithmetic error with a large effect. Net irrigation is weekly use minus effective rain, not weekly use alone. In the mid season example, 10 mm of effective rain removes 100 litres from a 403 litre weekly need on 10 square metres.
Treating Kc as exact to two decimal places is a false precision error. FAO 56 values are typical values for non stressed, well managed crops in subhumid climates. Local wind, humidity, variety, spacing, and soil can shift the true value.
Assuming a small walled garden matches field Kc is another trap. The calculator page states that Kc values are for field conditions, and that small gardens with walls or heat islands can use more. No extra amount is given on the page, so no number is quoted here.
Frequently Asked Questions
Q: What is crop coefficient by growth stage?
A: Crop coefficient by growth stage is the Kc value for a crop at a stated stage of growth. Kc adjusts ET0 to give ETc, which is crop water use. Kc starts low, rises through development, peaks at mid season, and falls in the late season.
Q: What is the Kc value for tomato at full canopy?
A: Tomato Kc at full canopy is 1.15. That value appears in the calculator worked example and in FAO 56 Table 12. At ET0 of 5 mm a day, ETc is 5.75 mm a day, rounded to 5.8 mm a day, which is 57.5 litres a day on 10 square metres.
Q: Why does Kc fall in the late season?
A: Kc falls in the late season because leaves age and the canopy thins. Senescence often begins with the lower leaves, so less leaf area intercepts sun and transpires water. FAO 56 gives tomato Kc at the end of the late season as 0.70 to 0.90.
Q: How do I turn Kc into litres per day?
A: Multiply Kc by ET0 to get ETc in millimetres a day, then multiply ETc by area in square metres to get litres a day, because 1 mm over 1 square metre equals 1 litre. For tomato at Kc 1.15 and ET0 5 mm a day on 10 square metres, the result is 57.5 litres a day.
Q: Can I use one Kc value for the whole season?
A: No. One Kc value for the whole season will overwater young plants and underwater plants at full canopy. Use 0.6 for the Solanum group at the initial stage, rise toward 1.15 through development, and hold 1.15 at mid season for tomato.
Q: What Kc value should I use in the development stage?
A: Use no single value for the whole development stage, because Kc rises through it. Start near 0.6 early in development and move up toward 1.15 as cover grows. Check ground cover each week and step the value up with it.
More guides
Hargreaves vs Penman Monteith: When the Simple Estimate Is Enough
Hargreaves vs penman monteith is a choice between a simple estimate from temperature alone and a fuller calculation from complete weather data.…
Read guide
Daily ET0 vs Monthly Average ET0: Planning vs Scheduling
Daily ET0 vs monthly ET0 is a choice between one day and a month. Use a monthly average to plan a season,…
Read guide
How Latitude and Date Change Your ET0
Latitude and ET0 are linked through Ra, the extraterrestrial radiation that reaches the top of the atmosphere. When latitude or date changes,…
Read guide