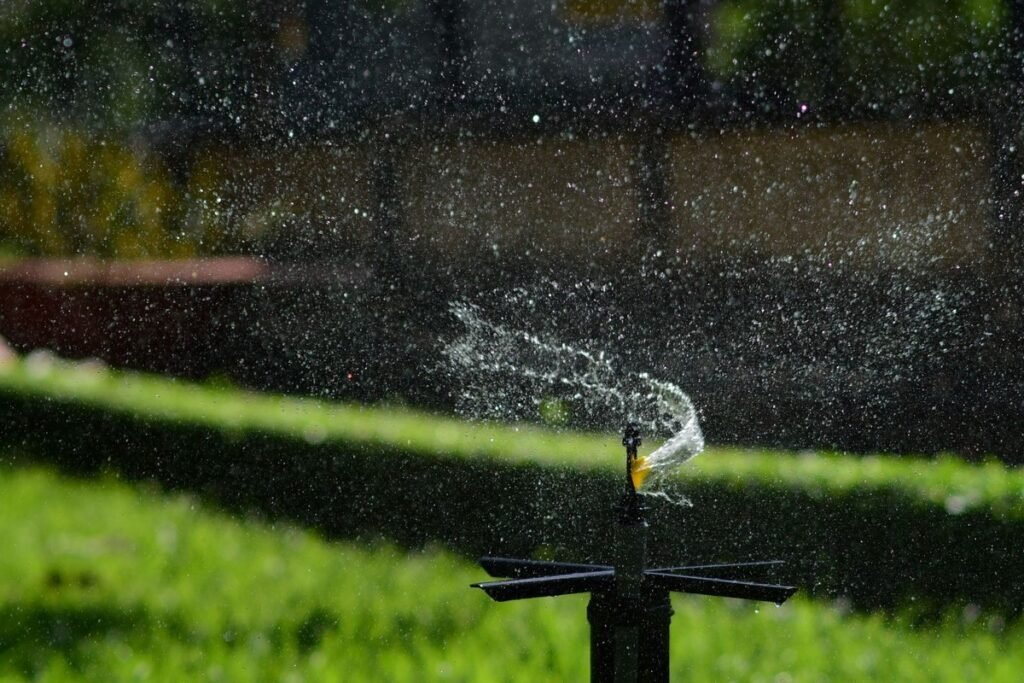
How long to run each zone depends on the depth of water you want, the efficiency of your system, and the precipitation rate of the zone. For the example on the page, 12 mm at 10 mm per hour and 80 percent efficiency takes 90 minutes. Minutes equal depth divided by efficiency divided by precipitation rate times 60.
How the minutes formula works
The Irrigation Run Time Calculator turns three inputs into one answer, the minutes to run each zone: the depth to apply at each watering, the precipitation rate of the zone, and the efficiency of the system. Minutes equal depth divided by efficiency divided by precipitation rate times 60. Depth is in mm, precipitation rate is in mm per hour, and efficiency is a decimal, so 80 percent is 0.80.
Work through the verified example. Depth is 12 mm, precipitation rate is 10 mm per hour, and efficiency is 80 percent. Divide 12 by 0.80 to get 15, divide by 10 to get 1.5 hours, and multiply by 60 to get 90 minutes. Other rates below are example inputs, and 10 mm per hour is the only rate verified on the page. An efficiency below 100 percent accounts for uneven coverage, wind and evaporation, so leave it at 80 percent unless you have tested your system.
How long to run each zone at 12 mm
Twelve mm sits at the low end of the page range, about 12 to 25 mm per watering, or 0.5 to 1 in. The page gives typical run times for the two common head types at this range. Typical spray heads run 15 to 30 minutes, and rotors often run 45 to 90 minutes per watering of about 12 to 25 mm. That gap follows directly from the precipitation rate. At the anchor rate of 10 mm per hour and 80 percent efficiency, 12 mm takes 90 minutes, at the top of the rotor range, because rotors apply water slowly, often under 12 mm per hour.
Minutes by depth and precipitation rate
The table below is the core of this blog. Read across a row to find your depth, then down a column to find your precipitation rate, and the cell gives the minutes at 80 percent efficiency. Only the 10 mm per hour column uses the verified page rate. Every other rate is an example input worked through the same formula. Use the table once you know your own rate.
| Depth to apply | Minutes at 5 mm per hour | Minutes at 8 mm per hour | Minutes at 10 mm per hour | Minutes at 12 mm per hour | Minutes at 15 mm per hour | Minutes at 20 mm per hour |
|---|---|---|---|---|---|---|
| 12 mm | 180 | 112.5 | 90 | 75 | 60 | 45 |
| 15 mm | 225 | 140.6 | 112.5 | 93.8 | 75 | 56.3 |
| 20 mm | 300 | 187.5 | 150 | 125 | 100 | 75 |
| 25 mm | 375 | 234.4 | 187.5 | 156.3 | 125 | 93.8 |
Two patterns let you estimate minutes without the table. Doubling the depth doubles the minutes at any rate, and doubling the precipitation rate halves the minutes at any depth. At 12 mm, a rate of 5 mm per hour takes 180 minutes, while a rate of 10 mm per hour takes 90 minutes.
How to find your precipitation rate
There are two ways to find the precipitation rate of a zone. The first uses flow and area. Precipitation rate equals flow times 60 divided by area, with flow in litres per minute, area in square metres, and the answer in mm per hour. One litre per minute over 1 square metre equals 60 mm per hour, so the same flow gives a high rate over a small area and a low rate over a large area.
The table below works the flow and area formula through for three example flows and three example areas. All flows and areas here are example inputs. A flow of 20 litres per minute over 50 square metres gives 24 mm per hour, while the same flow over 150 square metres gives only 8 mm per hour.
| Zone flow | Rate over 50 square metres | Rate over 100 square metres | Rate over 150 square metres |
|---|---|---|---|
| 10 litres per minute | 12.0 mm per hour | 6.0 mm per hour | 4.0 mm per hour |
| 15 litres per minute | 18.0 mm per hour | 9.0 mm per hour | 6.0 mm per hour |
| 20 litres per minute | 24.0 mm per hour | 12.0 mm per hour | 8.0 mm per hour |
The second way is the cup test, and it is the more reliable of the two for a zone that is already installed. Place straight sided cups across the zone, run it for 15 minutes, measure the average depth in the cups, and multiply by 4 to get mm per hour. If the cups hold an average of 2.5 mm after 15 minutes, the rate is 10 mm per hour, which matches the verified page example. The cup test also shows uneven coverage. If one cup holds 4 mm and another holds 1 mm, the zone is not applying water evenly, so keep efficiency at 80 percent or lower.
Sprays and rotors: why the minutes differ
Sprays and rotors differ in how fast they apply water, and that single difference explains the whole gap in their run times. Sprays apply water faster, so a spray zone reaches 12 to 25 mm in a short run, typically 15 to 30 minutes per watering. Rotors apply slowly, often under 12 mm per hour, so a rotor zone needs a long run, often 45 to 90 minutes, to apply the same depth.
Take the anchor depth of 12 mm at 80 percent efficiency. At a rotor rate of 10 mm per hour, the table gives 90 minutes, at the top of the typical rotor range. Water applied slowly has time to soak in, so a long rotor run is less likely to cause runoff.
On clay soil or a slope, even a spray run may need splitting. The page calls this cycle and soak, which means splitting one long run into several shorter ones with breaks, so water soaks in instead of running off. Use cycle and soak on clay or slopes, and keep the total minutes the same. Drip zones sit outside this comparison. Drip applies water slowly at the roots, so run times are longer but less water is wasted.
How efficiency changes the minutes
Efficiency acts as a divider in the formula, so a lower efficiency always means longer minutes for the same depth and rate. The table below holds the precipitation rate fixed at the verified 10 mm per hour and varies efficiency for two depths, 12 mm and 20 mm. The 80 percent column is the page default, while the other efficiencies are example inputs. At 12 mm, 70 percent efficiency needs 102.9 minutes, while 100 percent needs only 72 minutes. Do not set 100 percent unless you have tested the system.
| Depth to apply | Minutes at 70 percent efficiency | Minutes at 80 percent efficiency | Minutes at 90 percent efficiency | Minutes at 100 percent efficiency |
|---|---|---|---|---|
| 12 mm | 102.9 | 90 | 80 | 72 |
| 20 mm | 171.4 | 150 | 133.3 | 120 |
Weekly controller time for all zones
A single zone time is only half the story. The controller runs every zone in turn, so the weekly total decides whether the schedule fits the week. Weekly time equals minutes times days times zones. The table below uses the anchor of 90 minutes per zone, three watering days a week, and one to six zones. Four zones need 1080 minutes, or 18 hours, which matches the worked example on the page.
| Zones | Minutes per week at 90 minutes per zone, 3 days a week | Hours per week |
|---|---|---|
| 1 zone | 270 | 4.5 |
| 2 zones | 540 | 9 |
| 3 zones | 810 | 13.5 |
| 4 zones | 1080 | 18 |
| 5 zones | 1350 | 22.5 |
| 6 zones | 1620 | 27 |
The Garden Watering Schedule Calculator turns a weekly water need into sessions and minutes at the hose.
A rounded imperial example kept separate
The page worked example is metric only, in mm, and the imperial example below is separate and labelled as a rounded equivalent, not an exact conversion, using the same formula with inches. Apply 0.5 in with a system that delivers 0.4 in per hour at 80 percent efficiency. Divide 0.5 by 0.80 to get 0.625, divide by 0.4 to get 1.5625 hours, and multiply by 60 to get 93.75 minutes, shown as about 94 minutes.
Keep metric and imperial figures apart, and use one set of units all the way through.
How to read the minutes for your own zone
Start with the depth you want to apply at each watering, from 12 to 25 mm. Then find your precipitation rate, either from flow and area or from the cup test. Then read the minutes from the first table, or work them out with the formula, and set the controller to that figure for the zone. Each zone gets its own minutes, because each zone has its own rate. Use the Irrigation Scheduling Calculator to set the days between waterings.
After the first run, check the soil. Push a small trowel into the soil and see how deep the moisture reaches. If it is dry at the depth you wanted, your rate may be lower than the figure you used, so run the cup test and read the table again. If water is ponding or running off, split the run into cycles with soak breaks. Adjust run times seasonally as weather changes.
Common mistakes
- Using one run time for every zone. Spray and rotor zones need very different minutes for the same depth.
- Forgetting efficiency. At 12 mm and 10 mm per hour, 80 percent needs 90 minutes, while 100 percent needs only 72 minutes.
- Reading the table at the wrong depth. Minutes for 25 mm are near enough double those for 12 mm.
- Guessing the rate instead of measuring it. A cup test takes 15 minutes and gives a real rate.
- Mixing metric and imperial figures in one step. Keep the 12 mm tables and the 0.5 in example apart.
- Cutting minutes to fit the week. If six zones need 27 hours, review depth, days or the zone rate.
- Running a long spray run in one go on clay or a slope. Split it into cycles with soak breaks.
Frequently asked questions
Q: How long to run each zone for 12 mm?
A: At 10 mm per hour and 80 percent efficiency, 90 minutes. That is 12 divided by 0.80 divided by 10 times 60.
Q: How long to run each zone with a rotor?
A: Often 45 to 90 minutes per watering of about 12 to 25 mm. Rotors apply slowly, often under 12 mm per hour.
Q: How long to run each zone with a spray head?
A: Typically 15 to 30 minutes per watering of about 12 to 25 mm. Sprays apply water faster than rotors, so they reach the depth sooner.
Q: How do I find my precipitation rate?
A: Place straight sided cups across the zone, run it for 15 minutes, measure the average depth and multiply by 4 to get mm per hour. Or use flow times 60 divided by area.
Q: Why does my zone need more minutes than a zone with the same depth?
A: Because its precipitation rate is lower, or its efficiency is lower. A zone at 5 mm per hour needs 180 minutes for 12 mm at 80 percent efficiency, while a zone at 20 mm per hour needs only 45 minutes.
Q: How do I work out weekly controller time?
A: Multiply minutes per zone by watering days by zones. At 90 minutes per zone, three days a week and four zones, weekly time is 90 times 3 times 4, which equals 1080 minutes, or 18 hours.
More guides

How Many Zones Does My Supply Need
If you are asking how many zones does my supply need, the answer comes from two numbers. Add up the flow of…
Read guide
Head to Head Coverage Explained: Spacing, Corners, Edges and Middle
Head to head coverage means each sprinkler head sprays far enough to reach the head next to it, so the distance between…
Read guide
How Many Sprinkler Heads Do I Need
How many sprinkler heads do I need depends on lawn size and throw radius. A 10 by 6 metre lawn with 4…
Read guide